


Correlations, spurious and otherwise
Making the case for less software.

I nuked a backlog.
I first tried this shortly after inheriting a relatively mature portfolio of several products with large feature sets. I looked at the backlogs and thought, “What is all this?”
I sat with the team for several hours while they explained the roadmap. We reviewed about 10% of the requirements and supporting stories. I did some quick math, estimated we would spend about $20k going through the entire backlog, and decided on another tactic. In our backlog management tool, I filtered for every story in the backlog older than 365 days. The query returned more than five hundred stories. Then, I filtered for anything older than 180 days and found another 150 stories.
Over several years, the team accumulated this backlog, creating a clearinghouse of possibilities. Most stories had few details; some included expository notes about the urgency of the need articulated by each story’s source. None had gone through the process of validation and elaboration.
I sent my team a note explaining what I’d found and letting them know that any story meeting the 180-day or older criteria and lacking a compelling business case would be deleted by the following Friday. I gave them two weeks to sort it out and asked them to cap their time investment in the exercise to five hours.
A week later, I asked for a progress update. The team had pulled a small handful of stories, fleshed them out, and made a case for inclusion in the backlog. They asked for more time and insisted a trove of stories deserved analysis. I stuck to the original parameters.
A week later, we deleted almost 600 stories from the backlog.
“If they are important,” I said, “someone will come and ask for them again.”
The correlation curse
One of my favorite websites is Spurious Correlations, created by Tyler Vigen. Designed as a fun and “mildly educational” site, it gives me a solid chuckle each time I visit.
The gist is to gather a bunch of data and find random correlations between variables. Recent additions of GenAI-generated explanations and research papers (Spurious Scholar) add to the hilarity.
It’s hard to pick a favorite, but I like the correlation between wind power in Poland and the popularity of the name Eleanor mainly because the name Eleanor appears in my family more than once during the measured period, and 16B kWh seems like a lot (it turns out to be a little under 7% or Poland’s population).

Randall Munroe, the creator of xkcd, was born in Pennsylvania and raised in Virginia, where the crime rates are 10x and 5x higher than Vermont's. Munroe publishes a new comic on Mondays, Wednesdays, and Fridays. I have copies of What If? and How To on my bookshelves.
What does any of that prove? Nothing!
See what fun this is?

Get to the point
Companies compensate product organizations to deliver software. People tend to do exactly (and sometimes only) what you pay them to do. So, as product professionals, we deliver software as quickly and efficiently as possible.
Then, as optimistic product leaders, we do something undoubtedly nefarious: Falsely correlate feature delivery with revenue growth.
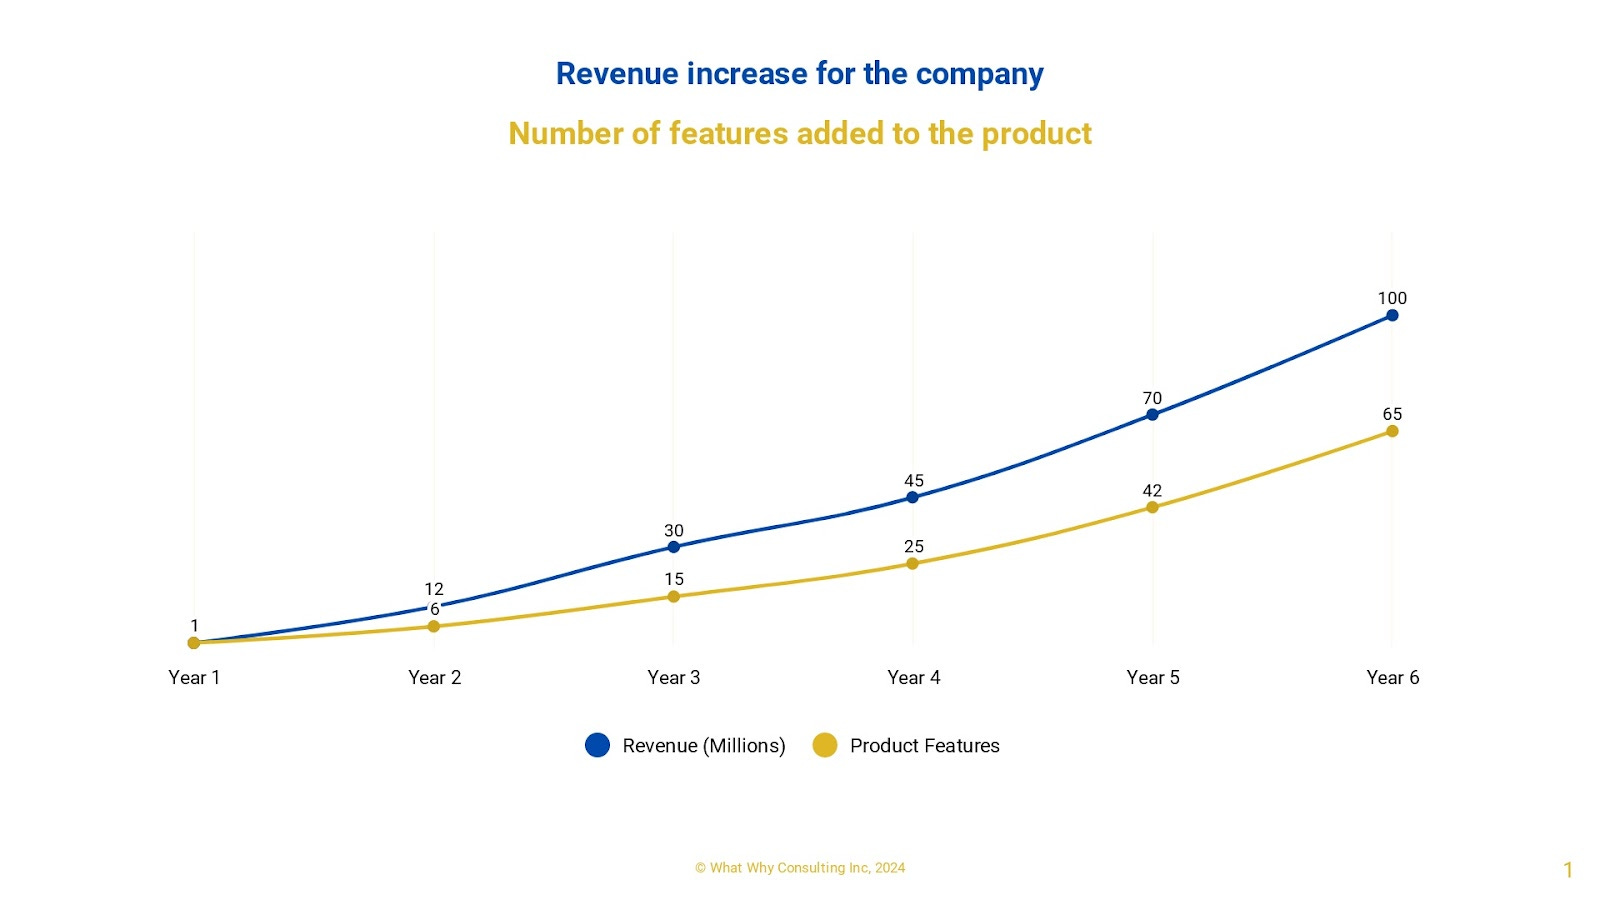
When your business is doing well, charts like this come easily. If customers ask for a feature, and if we build it, and then the customer buys the software, surely there must be a correlation between feature delivery and revenue growth, if not outright causation. It’s a tempting theory but unfounded.
The counterposition is that if you build more software, it becomes more complex, takes longer for a customer to experience value, and is therefore less likely to purchase.
The problem is that both conditions–more features/higher revenue and more complex/longer time to value–might be true simultaneously, and neither would adequately demonstrate a strong correlation to revenue growth (or decline).
More than once, I’ve leaned back in my chair, hands clasped behind my head, and thought, “We are producing a lot of product, and revenue is going up, so we must be doing something right.”
The case for less software
I frequently make the case for building less software, and I offer two compelling reasons for this.
Feature utilization
Applying the Pareto Principle to software utilization borders on cliche. The prevailing wisdom goes something like this: users engage with 20% of your features often, 30% infrequently, and 50% rarely or never.
I don’t know if these figures are accurate for your product. But if you don’t know which features are most or least used, start measuring utilization immediately. Find out why those features aren’t used: Are they unnecessary? Or too hard to use?
What should you do with that utilization data? Taking my backlog exercise as an example, use that data to cut as many features as possible as quickly as possible.
You’ve likely built more software than your customers need by falling prey to Power User Syndrome and Noisy Customer Complex. In Billy Idol's immortal words, they cried, “More! More! More!”
From experience, cutting those rarely used features yields a few extremely uncomfortable conversations. One of those features might be the darling of your highest revenue-generating customer. Or they might have asked for the feature because they genuinely thought it was important, and when you show them data proving how little they use it, they’ll be glad to see you drop it.
Software vulnerabilities
Security vendors are struggling, and software developers aren’t making it any easier. Last year, the number of vulnerabilities in the National Vulnerability Database (NVD) increased by more than 20%. The National Institute of Standards and Technology (NIST), which maintains the NVD, cannot cope with the volume and has analyzed just 31% of new CVEs received this year.
Why is NIST curtailing their analysis?
"This is based on a variety of factors, including an increase in software and, therefore, vulnerabilities…”
Verizon’s 2024 annual data breach incident report rang alarms, as usual. Breaches doubled, and vulnerability exploitation surged by 180%. According to IBM, the cost of a breach was up 15% in 2023, and there’s no reason to think that number will go down in 2024. It takes enterprises 55 days to remediate even half of critical vulnerabilities!
I offer an admonishment: you are releasing too much software, and most of it is catastrophically insecure.
Spurious or not?
Is the volume of software and the number of vulnerabilities spuriously correlated?
You can make a strong case for causation. Certainly, it is more directly correlated than the number of features is to your product’s revenue.
Prune your backlogs. Reduce your feature output. Be part of the solution, not a contributor to the problem.
This is a good reminder to focus on doing a few things well rather than many things poorly. Long term, the latter is unproductive and distracting. Who can say why something was done when it’s buried in chaff?